Visualizing the Panama Papers

Together with some friends, we did a “hackathon” project of building an interactive analytical app and deploying it within a day. We looked across the web for some data we could visualize, and highly influenced by Steven Soderbergh’s The Laundromat we had seen on Netflix recently, decided to use the data made available by the ICIJ on offshore tax haven leaks. The data was retrieved from ICIJ Offshore Leaks Database at https://offshoreleaks.icij.org
I guess this is also a good point to state that: “There are legitimate uses for offshore companies and trusts. We do not intend to suggest or imply that any people, companies or other entities included in the ICIJ Offshore Leaks Database have broken the law or otherwise acted improperly.”
First of all we downloaded all the data available, which was already nicely formatted. For simplicity we only used the panama papers leak (mostly due to using a free heroku dyno). We imported the data into pandas, and looked to reduce the size of the dataframe through both redundancy and irrelevancy.
import pandas as pd

pp = pd.read_csv('csv_panama_papers/panama_papers.nodes.entity.csv')

# Transform the provided data into a pandas date type
pp["incorporation_date"] = pd.to_datetime(pp["incorporation_date"])
pp['year'], pp['month'] = pp['incorporation_date'].dt.year, pp['incorporation_date'].dt.month

# Remove irrelevant features
pp.drop(["name", "inactivation_date", "struck_off_date", "ibcRUC",
        "status", "company_type", "valid_until", "note", "closed_date"], axis=1, inplace=True)

# Drop leaks before the 80s, only Panama companies and few in numbers
indexes = pp[pp["year"] < 1980].index.to_list()

# Drop any remaining None values
pp.drop(indexes, inplace=True)
pp.dropna(inplace=True)
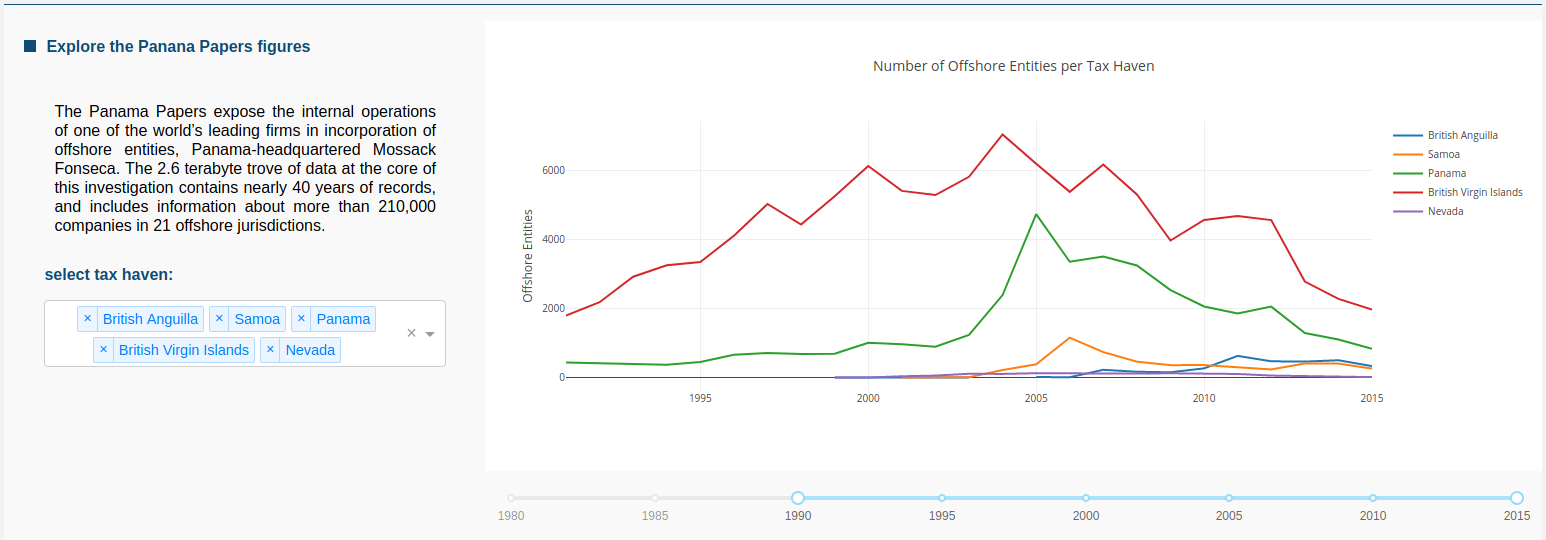
We then created our first plot which allows the visitor to select the countries they are interested in and see how many companies have been opened in the selected jurisdictions during the given year range. Anecdotally, we found the peaks and drops correspond with global tax crackdowns or scandals. The purpose of the tool is to be used as an exploratory tool.
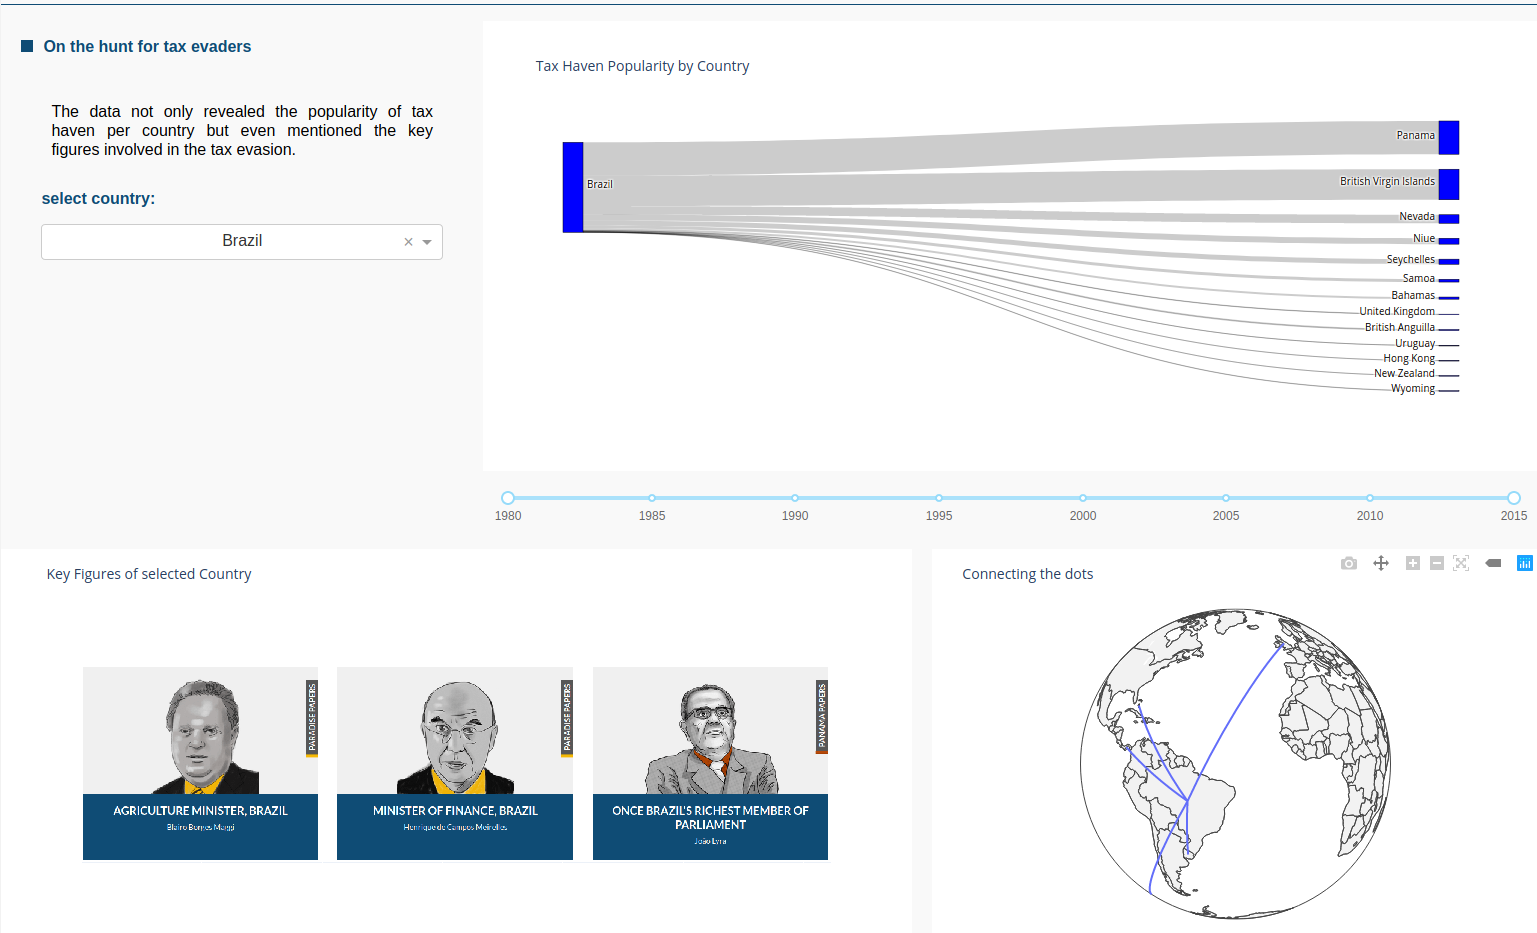
We also created a sankey flow, to see the most popular tax haven jurisdictions per country. In other words, by selecting Brazil we can see the most popular offshore jurisdictions in Brazil, this can also be adjusted for a custom year range. We also show the most notable people found in the leaks, as reported by ICIJ, as a small visualization.
To play around with the website, you can visit it at https://nuova-ims.herokuapp.com/ However, it’s running on a free-tier dyno at the moment, so it’ll probably be extremely slow / almost unusable. I will look into hosting side-projects on AWS lambda in the future perhaps.